
Nashville Predators at Philadelphia Flyers
· National Hockey LeagueZegras stays hot at home with two goals and an assist in Flyers' 4-1 win over Predators

Zegras, who leads the Flyers with 12 points, has at least one point in each of the team's seven home games this season, becoming just the third Flyer to do so in his first seven home games with the organization.
After a scoreless first period, Zegras snapped a wrist shot past Nashville goalie Juuse Saros 12:45 into the second period.
Zegras scored his fourth goal this season on the power play in the third period, one-timing a pass from Cam York past Saros.
Zegras also picked up an assist on Jamie Drysdale's first goal of the season in the second period.
Dan Vladar made 32 saves for the Flyers. Vladar has not allowed more than two goals in any of his six starts for Philadelphia this season.
Travis Konecny added an empty-net goal for the Flyers, who won their third straight game and improved to 6-1-0 at Xfinity Mobile Arena this season.
Matthew Wood scored his first career goal for the Predators when his shot redirected off Philadelphia defenseman Nick Seeler past Vladar at 18:03 of the second period.
Saros made 14 saves in Nashville's third straight loss.
Philadelphia captain Sean Couturier took a slap shot to the arm in the first period and immediately skated to the bench in pain. He did not return after the first intermission. The team provided no additional details on the injury.
Philadelphia: Continues a long stretch of home games when it hosts Toronto on Saturday.
Regular Season SeriesPHI leads series 1-0
Scoring Summary
 |
Goal | 2nd Period 12:45 | Trevor Zegras Goal (3) Wrist Shot, assists: Matvei Michkov (3), Owen Tippett (1) |
 |
Goal | 2nd Period 15:41 | Jamie Drysdale Goal (1) Wrist Shot, assists: Matvei Michkov (4), Trevor Zegras (8) |
 |
Goal | 2nd Period 18:03 | Matthew Wood Goal (1) Snap Shot, assists: Michael Bunting (2), Erik Haula (5) |
 |
Goal | 3rd Period 7:00 | Trevor Zegras Goal (4) Slap Shot, assists: Cam York (5), Noah Cates (4) |
 |
Goal | 3rd Period 15:54 | Travis Konecny Goal (3) Wrist Shot, assists: Christian Dvorak (3) |
Statistics
 NSH NSH |
 PHI PHI |
|
|---|---|---|
| 12 | Blocked Shots | 21 |
| 21 | Hits | 21 |
| 4 | Takeaways | 3 |
| 33 | Shots | 18 |
| 0 | Power Play Goals | 1 |
| 2 | Power Play Opportunities | 1 |
| 0.0 | Power Play Percentage | 100.0 |
| 0 | Short Handed Goals | 0 |
| 0 | Shootout Goals | 0 |
| 28 | Faceoffs Won | 23 |
| 54.9 | Faceoff Win Percent | 45.1 |
| 19 | Giveaways | 17 |
| 2 | Total Penalties | 3 |
| 4 | Penalty Minutes | 6 |
 Philadelphia Flyers Injuries
| NAME, POS | STATUS | DATE |
|---|---|---|
| Rasmus Ristolainen, D | Injured Reserve | Dec 13 |
 Nashville Predators Injuries
| NAME, POS | STATUS | DATE |
|---|
Game Information
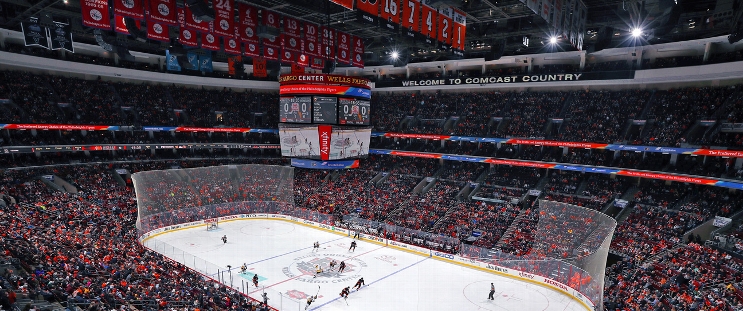 Xfinity Mobile Arena
Location: Philadelphia, PA
Attendance: 15,812 | Capacity:

Location: Philadelphia, PA
Attendance: 15,812 | Capacity:
2025-26 Metropolitan Division Standings
| TEAM | W | L | PTS | OTL |
|---|---|---|---|---|
 Carolina Carolina |
2 | 9 | 44 | 21 |
 NY Islanders NY Islanders |
3 | 11 | 41 | 19 |
 Washington Washington |
4 | 10 | 40 | 18 |
 Philadelphia Philadelphia |
6 | 9 | 38 | 16 |
 Pittsburgh Pittsburgh |
9 | 8 | 37 | 14 |
 New Jersey New Jersey |
1 | 14 | 37 | 18 |
 NY Rangers NY Rangers |
4 | 13 | 36 | 16 |
 Columbus Columbus |
6 | 13 | 32 | 13 |


