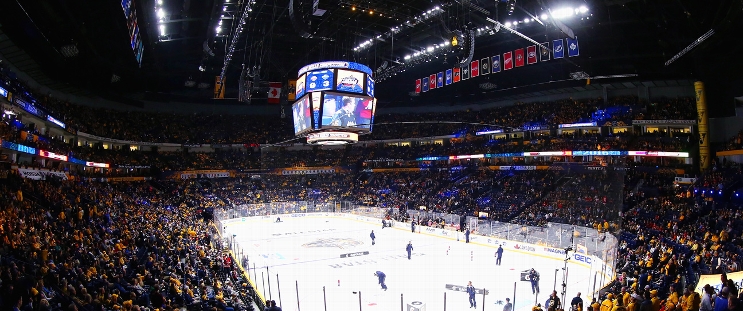
Tampa Bay Lightning at Nashville Predators
· National Hockey LeagueZemgus Girgensons scores twice as Lightning down Predators 5-2

Brandon Hagel, Nikita Kucherov and Charl-Edouard D’Astous also scored for the Lightning, and Andrei Vasilevskiy made 18 saves. After winning just one of their first seven games of the season, the Lightning have won three straight.
Anthony Cirelli and Pontus Holmberg each had two assists for the Lightning.
Luke Evangelista scored a goal and added an assist and Filip Forsberg also scored, and Juuse Saros made 25 saves for Nashville, losers of two in a row.
Girgensons scored the game’s first goal at 10:31 of the opening period. He missed the first seven games of the season with an upper-body injury. He later added his second late in the third.
Hagel doubled the Tampa Bay lead at 15:37 of the second.
Just eight seconds after a Lightning power play expired, Hagel was corralled a loose puck after a scramble in front of the Nashville net and slipped it past Saros.
Cirelli assisted on Hagel's goal, for his 300th career NHL point.
Hagel has two goals and four assists in his last three games.
Evangelista scored a power-play goal at 5:05 of the third.
After missing all of training camp, Evangelista signed a two-year, $6 million contract on Oct. 4.
D’Astous, playing in his third career game, scored his first NHL goal at 7:58 of the third.
Forsberg cut the Lightning lead to one at 17:54 of the third with Saros pulled for an extra attacker, but Kucherov's empty-net goal restored Tampa Bay's two-goal lead.
Nashville killed all four Lightning power plays in the game. They have allowed just one opponent power-play goal at home in 27 times short-handed this season.
Predators visit Philadelphia on Thursday night.
Regular Season SeriesTB leads series 1-0
Scoring Summary
 |
Goal | 1st Period 10:31 | Zemgus Girgensons Goal (1) Snap Shot, assists: Pontus Holmberg (3), Yanni Gourde (1) |
 |
Goal | 2nd Period 15:37 | Brandon Hagel Goal (2) Wrist Shot, assists: Anthony Cirelli (3) |
 |
Goal | 3rd Period 5:05 | Luke Evangelista Goal (1) Wrist Shot, assists: Erik Haula (3), Brady Skjei (3) |
 |
Goal | 3rd Period 7:58 | Charle-Edouard D'Astous Goal (1) Wrist Shot, assists: Brayden Point (6), Nikita Kucherov (6) |
 |
Goal | 3rd Period 17:54 | Filip Forsberg Goal (4) Wrist Shot, assists: Luke Evangelista (5), Erik Haula (4) |
 |
Goal | 3rd Period 19:07 | Nikita Kucherov Goal (4) Wrist Shot, assists: Brandon Hagel (5), Anthony Cirelli (4) |
 |
Goal | 3rd Period 19:33 | Zemgus Girgensons Goal (2) Wrist Shot, assists: Pontus Holmberg (4), Erik Cernak (2) |
Statistics
 TB TB |
 NSH NSH |
|
|---|---|---|
| 15 | Blocked Shots | 5 |
| 16 | Hits | 24 |
| 3 | Takeaways | 6 |
| 32 | Shots | 20 |
| 0 | Power Play Goals | 1 |
| 4 | Power Play Opportunities | 3 |
| 0.0 | Power Play Percentage | 33.3 |
| 0 | Short Handed Goals | 0 |
| 0 | Shootout Goals | 0 |
| 20 | Faceoffs Won | 39 |
| 33.9 | Faceoff Win Percent | 66.1 |
| 10 | Giveaways | 15 |
| 5 | Total Penalties | 6 |
| 10 | Penalty Minutes | 12 |
 Nashville Predators Injuries
| NAME, POS | STATUS | DATE |
|---|
 Tampa Bay Lightning Injuries
| NAME, POS | STATUS | DATE |
|---|---|---|
| Brandon Hagel, LW | Day-To-Day | Dec 15 |
| Emil Lilleberg, D | Injured Reserve | Dec 15 |
| Ryan McDonagh, D | Injured Reserve | Dec 15 |
| Andrei Vasilevskiy, G | Injured Reserve | Dec 15 |
| Erik Cernak, D | Injured Reserve | Dec 13 |
Game Information
 Bridgestone Arena
Location: Nashville, TN
Attendance: 17,159 | Capacity:

Location: Nashville, TN
Attendance: 17,159 | Capacity:


