
Toronto Blue Jays at Seattle Mariners
· ALCS - Game 3
13 - 4

Guerrero, Springer sparks Blue Jays, who hit 5HRs and cut Mariners ALCS lead to 2-1 with 13-4 rout
Julio Rodríguez’s two-run, first-inning homer off Shane Bieber put Seattle ahead and stirred thoughts of a possible sweep by a team seeking its first World Series appearance, but Andrés Giménez sparked the comeback with a tying, two-run homer in a five-run third against George Kirby.
Springer, Guerrero, Alejandro Kirk and Addison Barger went deep as the Blue Jays totaled 2,004 feet of homers among 18 hits.
Guerrero had four hits, falling a triple short of the cycle, after going 0 for 7 as the Blue Jays lost the first two games at home.
.“Obviously Vladdy was great," Springer said. "I think as a team, it was just a good overall game and it’s on to the next.”
A crowd of 46,471 at T-Mobile Park for Seattle's first home ALCS game since 2001 saw the teams combine to match the postseason record of eight combined home runs, set by the Chicago Cubs and St. Louis in Game 3 of the 2015 NL Division Series and matched by the Los Angeles Dodgers and Houston in Game 2 of the 2017 World Series.
Giménez hadn’t homered since Aug. 27 before his drive off a fastball from Kirby, who allowed eight runs, eight hits and two walks, taking the loss.
“The first couple innings I thought he was dynamite," Mariners manager Dan Wilson said. “This is a team that’s going to hurt you if you make mistakes on the plate. It looked like there were a couple that they were able to get to.”
Kirby's run-scoring wild pitch put Toronto ahead 3-2 and Daulton Varsho followed with a two-run double.
Springer homered in the fourth and Guerrero hit his fourth of the postseason for a 7-2 lead on the firsy pitch of the fifth.
Kirk added a three-run homer in the sixth and is hitting .413 (19 for 46) with eight RBI in 14 games at T-Mobile Park.
Bieber, who got the win, pitched shutout ball after the first and wound up allowing four hits in six innings — the longest outing by a Blue Jays starter in seven postseason games.
“Obviously didn’t the start the way he would have wanted to, but that’s pretty much who he is,” Springer said. "He can battle back from anything.”
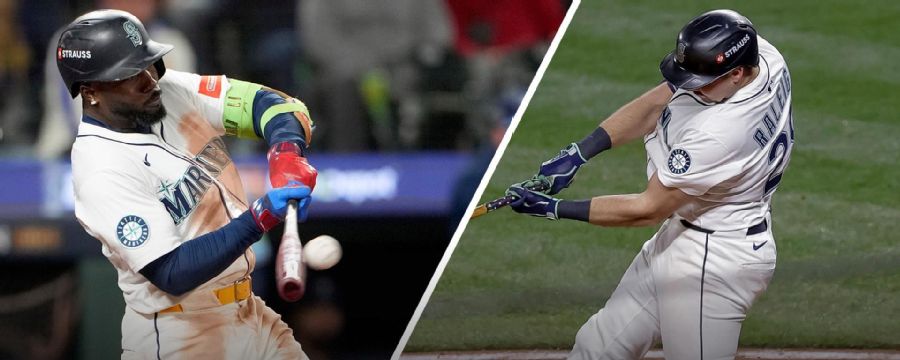
After the Blue Jays opened a 12-2 lead, Randy Arozarena connected in the eighth against Yariel Rodríguez for his first home run since Sept. 9 and Cal Raleigh, who led the major leagues with 60 home runs during the regular season, followed three pitches later with his third of the postseason.
How can I watch Toronto Blue Jays vs. Seattle Mariners?
- TV Channel: Blue Jays at Mariners 2022 MLB Baseball, is broadcasted on FS1.
- Online streaming: Sign up for Fubo.
Scoring Summary
 |
9th Inning | Robles grounded out to first. |
|
9th Inning | Garver fouled out to first. |
|
9th Inning | Ford to second on wild pitch by Fluharty. |
|
9th Inning | Garver hit for Canzone |
|
9th Inning | Suárez struck out swinging. |
|
9th Inning | Ford singled to center. |
Statistics
 TOR TOR |
 SEA SEA |
|
|---|---|---|
| 1 | Games Played | 1 |
| 1 | Team Games Played | 1 |
| 0 | Hit By Pitch | 0 |
| 14 | Ground Balls | 8 |
| 7 | Strikeouts | 10 |
| 12 | Runs Batted In | 4 |
| 0 | Sacrifice Hit | 0 |
| 18 | Hits | 8 |
| 0 | Stolen Bases | 1 |
| 3 | Walks | 1 |
| 0 | Catcher Interference | 0 |
| 13 | Runs | 4 |
| 0 | Ground Into Double Play | 1 |
| 0 | Sacrifice Flies | 0 |
| 44 | At Bats | 34 |
| 5 | Home Runs | 3 |
| 0 | Grand Slam Home Runs | 0 |
| 18 | Runners Left On Base | 10 |
| 0 | Triples | 0 |
| 0 | Game Winning RBIs | 0 |
| 1 | Intentional Walks | 0 |
| 4 | Doubles | 1 |
| 23 | Fly Balls | 16 |
| 0 | Caught Stealing | 0 |
| 143 | Pitches | 135 |
| 0 | Games Started | 0 |
| 0 | Pinch At Bats | 2 |
| 0 | Pinch Hits | 1 |
| 0.0 | Player Rating | 0.0 |
| 1 | Is Qualified | 1 |
| 0 | Is Qualified In Steals | 1 |
| 37 | Total Bases | 18 |
| 47 | Plate Appearances | 35 |
| 810.0 | Projected Home Runs | 486.0 |
| 9 | Extra Base Hits | 4 |
| 14.2 | Runs Created | 4.6 |
| .409 | Batting Average | .235 |
| .000 | Pinch Hit Average | .500 |
| .841 | Slugging Percentage | .529 |
| .500 | Secondary Average | .353 |
| .447 | On Base Percentage | .257 |
| 1.288 | OBP Pct + SLG Pct | .787 |
| 0.6 | Ground To Fly Ball Ratio | 0.5 |
| 14.7 | Runs Created Per 27 Outs | 4.6 |
| 91.0 | Batter Rating | 36.0 |
| 8.8 | At Bats Per Home Run | 11.3 |
| 0.00 | Stolen Base Percentage | 1.00 |
| 3.04 | Pitches Per Plate Appearance | 3.86 |
| .432 | Isolated Power | .294 |
| 0.43 | Walk To Strikeout Ratio | 0.10 |
| .064 | Walks Per Plate Appearance | .029 |
| .091 | Secondary Average Minus Batting Average | .118 |
| 25.0 | Runs Produced | 8.0 |
| 0.9 | Runs Ratio | 1.0 |
| 0.9 | Patience Ratio | 0.6 |
| 0.4 | Balls In Play Average | 0.2 |
| 131.5 | MLB Rating | 84.5 |
| 0.0 | Offensive Wins Above Replacement | 0.0 |
| 0.0 | Wins Above Replacement | 0.0 |
Game Information

Location: Seattle, Washington
Attendance: 46,471 | Capacity:
2025 American League East Standings
| TEAM | W | L | PCT | GB | STRK |
|---|---|---|---|---|---|
| Toronto |
- | 68 | W4 | 0.5802469 | 94 |
 New York New York |
- | 68 | W8 | 0.5802469 | 94 |
 Boston Boston |
5 | 73 | W1 | 0.5493827 | 89 |
 Tampa Bay Tampa Bay |
17 | 85 | L4 | 0.47530866 | 77 |
 Baltimore Baltimore |
19 | 87 | L3 | 0.46296296 | 75 |
2025 American League West Standings
| TEAM | W | L | PCT | GB | STRK |
|---|---|---|---|---|---|
| Seattle |
- | 72 | L3 | 0.5555556 | 90 |
 Houston Houston |
3 | 75 | W2 | 0.537037 | 87 |
 Texas Texas |
9 | 81 | L2 | 0.5 | 81 |
 Athletics Athletics |
14 | 86 | L2 | 0.4691358 | 76 |
 Los Angeles Los Angeles |
18 | 90 | L2 | 0.44444445 | 72 |