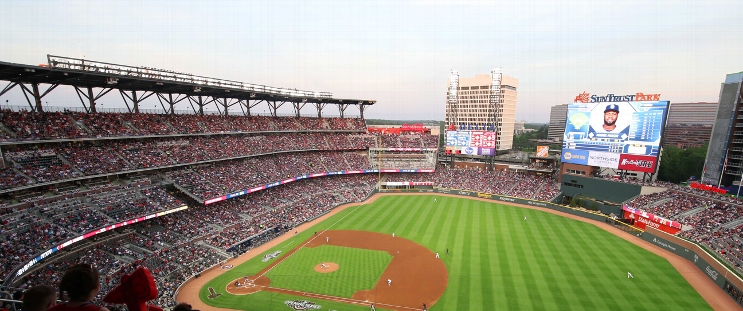
Washington Nationals at Atlanta Braves
· Major League Baseball
4 - 3

Nationals snap Braves' 10-game winning streak with 4-3 win

Mitchell Parker (9-16) got the final two outs of the fifth inning and earned the victory out of the bullpen for Washington. He relieved rookie Andrew Alvarez, who did not give up a run in 4 1/3 innings in his fifth career start.
Rookie Daylen Lile had three hits including an RBI single for the Nationals. Jose Ferrer earned his 10th save.
Wood's two solo home runs gave him 30 for the season. He hit them in the sixth and eighth innings. Bell led off the fourth inning with his 21st home run.
Eli White hit a pinch-hit home run for the Braves to lead off the ninth inning. Drake Baldwin hit his 19th home run in the sixth inning, a solo shot to left field. Marcell Ozuna also hit a solo homer in the eighth. The two teams hit 10 solo home runs in the final two games of the series.
Bryce Elder (8-11) took the loss in his final start of the season, giving up three runs on six hits in seven innings. He struck out seven.
How can I watch Washington Nationals vs. Atlanta Braves?
- TV Channel: Nationals at Braves 2022 MLB Baseball, is broadcasted on MLBN.
- Online streaming: Sign up for Fubo.
Scoring Summary
 |
9th Inning | Baldwin grounded out to second. |
 |
9th Inning | Acuña Jr. reached on infield single to shortstop. |
 |
9th Inning | Olson struck out swinging. |
 |
9th Inning | Profar struck out swinging. |
 |
9th Inning | White homered to center (436 feet). |
 |
9th Inning | Ferrer relieved Rutledge |
Statistics
 WSH WSH |
 ATL ATL |
|
|---|---|---|
| 1 | Games Played | 1 |
| 1 | Team Games Played | 1 |
| 0 | Hit By Pitch | 0 |
| 8 | Ground Balls | 9 |
| 9 | Strikeouts | 11 |
| 4 | Runs Batted In | 3 |
| 0 | Sacrifice Hit | 0 |
| 9 | Hits | 6 |
| 0 | Stolen Bases | 1 |
| 0 | Walks | 7 |
| 0 | Catcher Interference | 0 |
| 4 | Runs | 3 |
| 2 | Ground Into Double Play | 0 |
| 0 | Sacrifice Flies | 0 |
| 34 | At Bats | 33 |
| 3 | Home Runs | 3 |
| 0 | Grand Slam Home Runs | 0 |
| 6 | Runners Left On Base | 23 |
| 0 | Triples | 0 |
| 1 | Game Winning RBIs | 0 |
| 0 | Intentional Walks | 0 |
| 1 | Doubles | 0 |
| 17 | Fly Balls | 13 |
| 0 | Caught Stealing | 0 |
| 121 | Pitches | 172 |
| 0 | Games Started | 0 |
| 0 | Pinch At Bats | 1 |
| 0 | Pinch Hits | 1 |
| 0.0 | Player Rating | 0.0 |
| 1 | Is Qualified | 1 |
| 0 | Is Qualified In Steals | 1 |
| 19 | Total Bases | 15 |
| 34 | Plate Appearances | 40 |
| 486.0 | Projected Home Runs | 486.0 |
| 4 | Extra Base Hits | 3 |
| 4.4 | Runs Created | 5.5 |
| .265 | Batting Average | .182 |
| .000 | Pinch Hit Average | 1.000 |
| .559 | Slugging Percentage | .455 |
| .294 | Secondary Average | .515 |
| .265 | On Base Percentage | .325 |
| .824 | OBP Pct + SLG Pct | .780 |
| 0.5 | Ground To Fly Ball Ratio | 0.7 |
| 4.4 | Runs Created Per 27 Outs | 5.5 |
| 36.0 | Batter Rating | 28.0 |
| 11.3 | At Bats Per Home Run | 11.0 |
| 0.00 | Stolen Base Percentage | 1.00 |
| 3.56 | Pitches Per Plate Appearance | 4.30 |
| .294 | Isolated Power | .273 |
| 0.00 | Walk To Strikeout Ratio | 0.64 |
| .000 | Walks Per Plate Appearance | .175 |
| .029 | Secondary Average Minus Batting Average | .333 |
| 8.0 | Runs Produced | 6.0 |
| 1.0 | Runs Ratio | 1.0 |
| 0.6 | Patience Ratio | 0.6 |
| 0.3 | Balls In Play Average | 0.2 |
| 86.5 | MLB Rating | 78.5 |
| 0.0 | Offensive Wins Above Replacement | 0.0 |
| 0.0 | Wins Above Replacement | 0.0 |
Game Information

Location: Atlanta, Georgia
Attendance: 32,898 | Capacity:
2025 National League East Standings
| TEAM | W | L | PCT | GB | STRK |
|---|---|---|---|---|---|
 Philadelphia Philadelphia |
- | 66 | W1 | 0.5925926 | 96 |
 New York New York |
13 | 79 | L1 | 0.5123457 | 83 |
 Miami Miami |
17 | 83 | W1 | 0.48765433 | 79 |
 Atlanta Atlanta |
20 | 86 | W1 | 0.4691358 | 76 |
 Washington Washington |
30 | 96 | L1 | 0.4074074 | 66 |