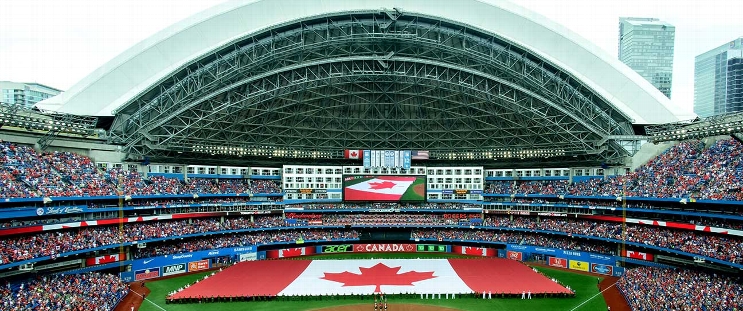
Minnesota Twins at Toronto Blue Jays
· Major League Baseball
4 - 10

Scherzer wins 3rd straight start, Blue Jays use a big 1st inning for a 10-4 win over Twins

Vladimir Guerrero Jr. added a two-run single as the AL East-leading Blue Jays won for the 30th time in 39 home games.
Scherzer (5-2) allowed four runs and four hits, including two home runs. He struck out five and walked one. The three-time Cy Young Award winner is 10-2 in 19 career starts against the Twins.
Minnesota’s Matt Wallner homered twice off Scherzer, his 18th and 19th, but the Twins lost for the sixth time in seven games.
Twins starter Joe Ryan gave up four runs and four hits in a shaky first inning. Bo Bichette hit an RBI single and a second run scored on Daulton Varsho’s sacrifice fly before Kirk hit a two-run homer, his 11th.
Giménez extended the lead with a 422-foot drive on Ryan’s first pitch of the second. The homer was Giménez’s sixth.
Ryan (12-7) matched a season high by allowing six runs and seven hits in five innings. He lost consecutive starts for the first time this season.
Wallner hit a solo shot in the fourth and a two-run drive in the sixth. It was his first mult-ihomer game of the season and the second of his career.
Guerrero started at designated hitter, his first start since leaving an Aug. 18 game at Pittsburgh because of a sore left hamstring. Guerrero popped out as a pinch hitter in Sunday’s loss at Miami.
----
How can I watch Minnesota Twins vs. Toronto Blue Jays?
- TV Channel: Twins at Blue Jays 2022 MLB Baseball, is broadcasted on MLB.TV.
- Online streaming: Sign up for Fubo.
Scoring Summary
 |
9th Inning | Julien grounded out to pitcher. |
 |
9th Inning | Lewis popped out to second. |
 |
9th Inning | Clemens walked. |
 |
9th Inning | Jeffers flied out to right. |
 |
9th Inning | Nance relieved Bruihl |
 |
9th Inning | Straw in left field. |
Statistics
 MIN MIN |
 TOR TOR |
|
|---|---|---|
| 1 | Games Played | 1 |
| 1 | Team Games Played | 1 |
| 0 | Hit By Pitch | 1 |
| 10 | Ground Balls | 10 |
| 6 | Strikeouts | 7 |
| 4 | Runs Batted In | 10 |
| 0 | Sacrifice Hit | 0 |
| 5 | Hits | 10 |
| 0 | Stolen Bases | 3 |
| 3 | Walks | 5 |
| 0 | Catcher Interference | 0 |
| 4 | Runs | 10 |
| 0 | Ground Into Double Play | 2 |
| 0 | Sacrifice Flies | 1 |
| 32 | At Bats | 31 |
| 2 | Home Runs | 2 |
| 0 | Grand Slam Home Runs | 0 |
| 9 | Runners Left On Base | 15 |
| 0 | Triples | 0 |
| 0 | Game Winning RBIs | 1 |
| 0 | Intentional Walks | 0 |
| 0 | Doubles | 3 |
| 16 | Fly Balls | 15 |
| 0 | Caught Stealing | 0 |
| 142 | Pitches | 152 |
| 0 | Games Started | 0 |
| 0 | Pinch At Bats | 0 |
| 0 | Pinch Hits | 0 |
| 0.0 | Player Rating | 0.0 |
| 1 | Is Qualified | 1 |
| 0 | Is Qualified In Steals | 1 |
| 11 | Total Bases | 19 |
| 35 | Plate Appearances | 38 |
| 324.0 | Projected Home Runs | 324.0 |
| 2 | Extra Base Hits | 5 |
| 2.6 | Runs Created | 7.9 |
| .156 | Batting Average | .323 |
| .000 | Pinch Hit Average | .000 |
| .344 | Slugging Percentage | .613 |
| .281 | Secondary Average | .548 |
| .229 | On Base Percentage | .421 |
| .572 | OBP Pct + SLG Pct | 1.034 |
| 0.6 | Ground To Fly Ball Ratio | 0.7 |
| 2.6 | Runs Created Per 27 Outs | 8.9 |
| 27.0 | Batter Rating | 65.0 |
| 16.0 | At Bats Per Home Run | 15.5 |
| 0.00 | Stolen Base Percentage | 1.00 |
| 4.06 | Pitches Per Plate Appearance | 4.00 |
| .188 | Isolated Power | .290 |
| 0.50 | Walk To Strikeout Ratio | 0.71 |
| .086 | Walks Per Plate Appearance | .132 |
| .125 | Secondary Average Minus Batting Average | .226 |
| 8.0 | Runs Produced | 20.0 |
| 1.0 | Runs Ratio | 1.0 |
| 0.4 | Patience Ratio | 0.7 |
| 0.1 | Balls In Play Average | 0.4 |
| 75.5 | MLB Rating | 103.5 |
| 0.0 | Offensive Wins Above Replacement | 0.0 |
| 0.0 | Wins Above Replacement | 0.0 |
Game Information

Location: Toronto, Ontario
Attendance: 41,845 | Capacity:
2025 American League Central Standings
| TEAM | W | L | PCT | GB | STRK |
|---|---|---|---|---|---|
 Detroit Detroit |
- | 62 | L1 | 0.5694444 | 82 |
 Cleveland Cleveland |
8.5 | 70 | W4 | 0.5104895 | 73 |
 Kansas City Kansas City |
9 | 71 | L2 | 0.5069444 | 73 |
 Minnesota Minnesota |
18 | 80 | W2 | 0.44444445 | 64 |
 Chicago Chicago |
27 | 89 | W1 | 0.38194445 | 55 |
2025 American League East Standings
| TEAM | W | L | PCT | GB | STRK |
|---|---|---|---|---|---|
 Toronto Toronto |
- | 61 | L2 | 0.57342654 | 82 |
 New York New York |
2 | 63 | W2 | 0.55944055 | 80 |
 Boston Boston |
3 | 65 | W2 | 0.55172414 | 80 |
 Tampa Bay Tampa Bay |
11 | 72 | L3 | 0.4965035 | 71 |
 Baltimore Baltimore |
16 | 77 | L1 | 0.46153846 | 66 |