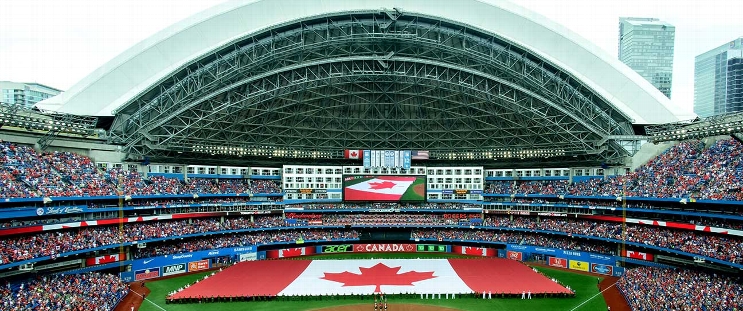
Texas Rangers at Toronto Blue Jays
· Major League Baseball
2 - 14

Myles Straw stars as the AL-leading Blue Jays pound the slumping Rangers 14-2

Daulton Varsho and Davis Schneider also went deep as the AL-leading Blue Jays improved to 42-20 at home. Varsho went 3 for 3 and scored three times, and Schneider had three hits and four RBI.
Straw hit a three-run homer off Patrick Corbin in Toronto’s six-run second inning. He also connected for his fourth homer in the third, a two-run shot off Jon Gray. He finished with four hits.
Varsho made it 10-1 with a first-pitch homer off Gray in the fifth, his 13th.
Schneider added a three-run shot off position player Rowdy Tellez in the seventh, his eighth.
Toronto’s Eric Lauer (8-2) allowed one run and four hits in five-plus innings, winning his fourth straight decision.
Jake Burger had three hits, including two RBI singles, but Texas lost for the eighth time in nine games.
Catcher Tyler Heineman pitched the ninth inning for Toronto.
Corbin (6-9) allowed a season-high seven runs in 2 1/3 innings, his shortest outing of 2025. Corbin is winless since July 10 and hasn’t finished the fifth inning in any of his past three starts.
Toronto’s George Springer went 1 for 4 as the designated hitter. Springer last played July 28, when he was hit in the helmet by a fastball from Baltimore’s Kade Strowd.
Rangers infielder Marcus Semien rested because of right wrist soreness.
----
How can I watch Texas Rangers vs. Toronto Blue Jays?
- TV Channel: Rangers at Blue Jays 2022 MLB Baseball, is broadcasted on MLB.TV.
- Online streaming: Sign up for Fubo.
Scoring Summary
 |
9th Inning | Jung grounded into fielder's choice to third, Burger out at second. |
 |
9th Inning | Burger singled to center, Langford scored. |
 |
9th Inning | Pederson grounded out to pitcher, Langford to second. |
 |
9th Inning | Langford grounded into fielder's choice to shortstop, Carter out at second. |
 |
9th Inning | Carter hit by pitch. |
 |
9th Inning | Heineman relieved Domínguez |
Statistics
 TEX TEX |
 TOR TOR |
|
|---|---|---|
| 1 | Games Played | 1 |
| 1 | Team Games Played | 1 |
| 2 | Hit By Pitch | 1 |
| 10 | Ground Balls | 11 |
| 8 | Strikeouts | 5 |
| 2 | Runs Batted In | 14 |
| 0 | Sacrifice Hit | 0 |
| 7 | Hits | 18 |
| 1 | Stolen Bases | 0 |
| 4 | Walks | 5 |
| 0 | Catcher Interference | 0 |
| 2 | Runs | 14 |
| 0 | Ground Into Double Play | 2 |
| 0 | Sacrifice Flies | 0 |
| 35 | At Bats | 39 |
| 0 | Home Runs | 4 |
| 0 | Grand Slam Home Runs | 0 |
| 23 | Runners Left On Base | 11 |
| 0 | Triples | 0 |
| 0 | Game Winning RBIs | 1 |
| 0 | Intentional Walks | 0 |
| 2 | Doubles | 3 |
| 17 | Fly Balls | 23 |
| 0 | Caught Stealing | 0 |
| 153 | Pitches | 154 |
| 0 | Games Started | 0 |
| 0 | Pinch At Bats | 0 |
| 0 | Pinch Hits | 0 |
| 0.0 | Player Rating | 0.0 |
| 1 | Is Qualified | 1 |
| 1 | Is Qualified In Steals | 0 |
| 9 | Total Bases | 33 |
| 41 | Plate Appearances | 45 |
| 0.0 | Projected Home Runs | 648.0 |
| 2 | Extra Base Hits | 7 |
| 3.5 | Runs Created | 13.9 |
| .200 | Batting Average | .462 |
| .000 | Pinch Hit Average | .000 |
| .257 | Slugging Percentage | .846 |
| .200 | Secondary Average | .513 |
| .317 | On Base Percentage | .533 |
| .574 | OBP Pct + SLG Pct | 1.379 |
| 0.6 | Ground To Fly Ball Ratio | 0.5 |
| 3.4 | Runs Created Per 27 Outs | 16.3 |
| 20.0 | Batter Rating | 92.0 |
| 0.0 | At Bats Per Home Run | 9.8 |
| 1.00 | Stolen Base Percentage | 0.00 |
| 3.73 | Pitches Per Plate Appearance | 3.42 |
| .057 | Isolated Power | .385 |
| 0.50 | Walk To Strikeout Ratio | 1.00 |
| .098 | Walks Per Plate Appearance | .111 |
| .000 | Secondary Average Minus Batting Average | .051 |
| 4.0 | Runs Produced | 28.0 |
| 1.0 | Runs Ratio | 1.0 |
| 0.4 | Patience Ratio | 0.9 |
| 0.3 | Balls In Play Average | 0.5 |
| 71.8 | MLB Rating | 133.0 |
| 0.0 | Offensive Wins Above Replacement | 0.0 |
| 0.0 | Wins Above Replacement | 0.0 |
Game Information

Location: Toronto, Ontario
Attendance: 42,686 | Capacity:
2025 American League West Standings
| TEAM | W | L | PCT | GB | STRK |
|---|---|---|---|---|---|
 Houston Houston |
- | 67 | L2 | 0.537931 | 78 |
 Seattle Seattle |
1 | 68 | W4 | 0.53103447 | 77 |
 Texas Texas |
2 | 70 | W4 | 0.52380955 | 77 |
 Los Angeles Los Angeles |
9.5 | 77 | W2 | 0.47260273 | 69 |
 Athletics Athletics |
12 | 80 | W1 | 0.45578232 | 67 |
2025 American League East Standings
| TEAM | W | L | PCT | GB | STRK |
|---|---|---|---|---|---|
 Toronto Toronto |
- | 61 | W1 | 0.5763889 | 83 |
 New York New York |
3 | 64 | L1 | 0.5555556 | 80 |
 Boston Boston |
3.5 | 66 | L1 | 0.5510204 | 81 |
 Tampa Bay Tampa Bay |
11 | 72 | W1 | 0.5 | 72 |
 Baltimore Baltimore |
16 | 77 | W1 | 0.4652778 | 67 |