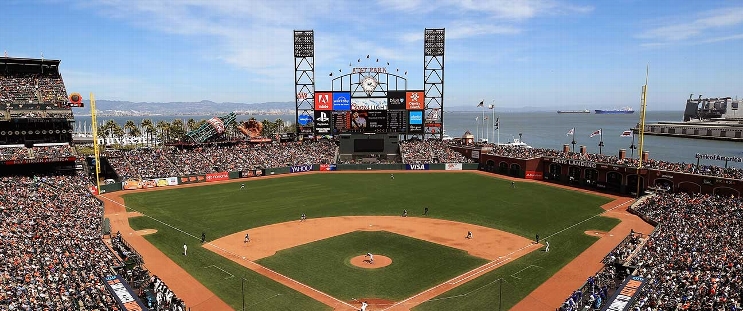
Washington Nationals at San Francisco Giants
· Major League Baseball
8 - 0

Nationals beat Giants 8-0 and spoil Justin Verlander's 3,500th career strikeout

Josh Bell and Paul DeJong had three hits apiece to highlight a 17-hit day for Washington. James Wood had a pair of two-run doubles as the Nationals won a series at Oracle Park for the fourth straight season.
Verlander (1-9), the three-time Cy Young Award winner who has struggled in his first season with the Giants, struck out the side in the first inning and became the 10th pitcher in MLB history with 3,500 strikeouts.
The milestone mark was the lone bright spot for the 42-year-old Verlander, who was unbeaten in five career starts against the Nationals before Sunday. He allowed 11 hits and five runs with six strikeouts and a walk.
MacKenzie Gore (5-12) had 10 strikeouts and pitched six scoreless innings for his first win since July 9. Cole Henry, PJ Poulin and Clayton Beeter each retired three batters to complete the three-hit shutout.
Abrams started Washington’s offensive onslaught in the second inning with a two-out home run off Verlander that hit the foul pole in right. That came three pitches after Wood doubled in a pair of runs.
Wood also connected for a two-run double off Spencer Bivens in the seventh.
Nationals RHP Cade Cavalli (0-0, 0.00) pitches against Royals LHP Bailey Falter (7-6, 4.14) on Monday in his second start since 2022.
How can I watch Washington Nationals vs. San Francisco Giants?
- TV Channel: Nationals at Giants 2022 MLB Baseball, is broadcasted on MLB.TV.
- Online streaming: Sign up for Fubo.
Scoring Summary
 |
9th Inning | Flores fouled out to catcher. |
 |
9th Inning | Adames struck out swinging. |
 |
9th Inning | Devers grounded out to shortstop. |
 |
9th Inning | Beeter relieved Poulin |
 |
9th Inning | Young lined out to center. |
 |
9th Inning | House singled to left. |
Statistics
 WSH WSH |
 SF SF |
|
|---|---|---|
| 1 | Games Played | 1 |
| 1 | Team Games Played | 1 |
| 0 | Hit By Pitch | 0 |
| 11 | Ground Balls | 6 |
| 8 | Strikeouts | 15 |
| 8 | Runs Batted In | 0 |
| 0 | Sacrifice Hit | 0 |
| 17 | Hits | 3 |
| 1 | Stolen Bases | 0 |
| 1 | Walks | 1 |
| 0 | Catcher Interference | 0 |
| 8 | Runs | 0 |
| 1 | Ground Into Double Play | 0 |
| 0 | Sacrifice Flies | 0 |
| 44 | At Bats | 30 |
| 1 | Home Runs | 0 |
| 0 | Grand Slam Home Runs | 0 |
| 20 | Runners Left On Base | 11 |
| 0 | Triples | 0 |
| 1 | Game Winning RBIs | 0 |
| 0 | Intentional Walks | 0 |
| 4 | Doubles | 0 |
| 25 | Fly Balls | 9 |
| 0 | Caught Stealing | 0 |
| 159 | Pitches | 131 |
| 0 | Games Started | 0 |
| 0 | Pinch At Bats | 0 |
| 0 | Pinch Hits | 0 |
| 0.0 | Player Rating | 0.0 |
| 1 | Is Qualified | 1 |
| 1 | Is Qualified In Steals | 0 |
| 24 | Total Bases | 3 |
| 45 | Plate Appearances | 31 |
| 162.0 | Projected Home Runs | 0.0 |
| 5 | Extra Base Hits | 0 |
| 8.8 | Runs Created | -1.0 |
| .386 | Batting Average | .100 |
| .000 | Pinch Hit Average | .000 |
| .545 | Slugging Percentage | .100 |
| .205 | Secondary Average | .033 |
| .400 | On Base Percentage | .129 |
| .945 | OBP Pct + SLG Pct | .229 |
| 0.4 | Ground To Fly Ball Ratio | 0.7 |
| 8.5 | Runs Created Per 27 Outs | -1.0 |
| 61.0 | Batter Rating | 3.0 |
| 44.0 | At Bats Per Home Run | 0.0 |
| 1.00 | Stolen Base Percentage | 0.00 |
| 3.53 | Pitches Per Plate Appearance | 4.23 |
| .159 | Isolated Power | .000 |
| 0.13 | Walk To Strikeout Ratio | 0.07 |
| .022 | Walks Per Plate Appearance | .032 |
| -.182 | Secondary Average Minus Batting Average | -.067 |
| 16.0 | Runs Produced | 0.0 |
| 1.0 | Runs Ratio | 0.0 |
| 0.6 | Patience Ratio | 0.1 |
| 0.5 | Balls In Play Average | 0.2 |
| 107.8 | MLB Rating | 54.8 |
| 0.0 | Offensive Wins Above Replacement | 0.0 |
| 0.0 | Wins Above Replacement | 0.0 |
Game Information

Location: San Francisco, California
Attendance: 40,089 | Capacity:
2025 National League East Standings
| TEAM | W | L | PCT | GB | STRK |
|---|---|---|---|---|---|
 Philadelphia Philadelphia |
- | 60 | W3 | 0.5890411 | 86 |
 New York New York |
10 | 70 | L5 | 0.5205479 | 76 |
 Miami Miami |
19 | 79 | W1 | 0.45890412 | 67 |
 Atlanta Atlanta |
21 | 81 | L2 | 0.44520548 | 65 |
 Washington Washington |
25.5 | 85 | L1 | 0.41379312 | 60 |
2025 National League West Standings
| TEAM | W | L | PCT | GB | STRK |
|---|---|---|---|---|---|
 Los Angeles Los Angeles |
- | 64 | W4 | 0.56164384 | 82 |
 San Diego San Diego |
3 | 67 | L2 | 0.5410959 | 79 |
 San Francisco San Francisco |
8 | 72 | L1 | 0.5068493 | 74 |
 Arizona Arizona |
9.5 | 74 | W1 | 0.49659863 | 73 |
 Colorado Colorado |
42 | 106 | L5 | 0.2739726 | 40 |