
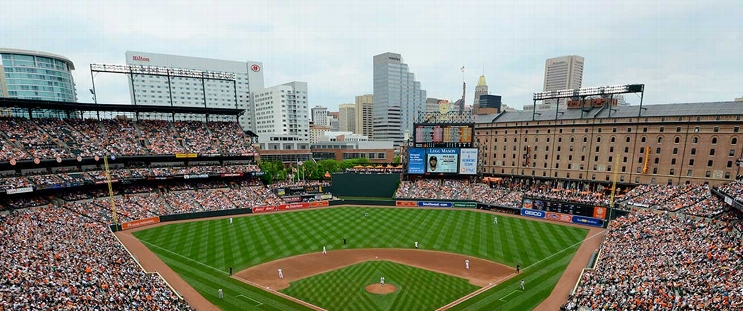
Athletics at Baltimore Orioles
· Major League Baseball
3 - 2

Willie MacIver hits a 2-run double in the 9th to rally Athletics over Orioles

MacIver's liner down the left-field line against Akin (3-2) scored Darell Hernaiz and Lawrence Butler, the latter of whom pinch ran for Gio Urshela and ran through third base coach Eric Martins' stop sign.
The relay throw came in ahead of Butler, but was in the dirt and slightly off line. Catcher Alex Jackson couldn't scoop it in time to make the tag.
Elvis Alvarado (1-0) recorded the final five outs against Baltimore. Brent Rooker singled in the other A's run in the sixth before departing in the bottom of the eighth with an apparent cramp or injury. Athletics manager Mark Kotsay said Rooker's departure was preventative.
Jordan Westburg hit his 14th home run for Baltimore in the fifth inning of a bullpen game for the Athletics, and Coby Mayo put the Orioles ahead again in the seventh with a pinch-hit double.
Orioles: Continue their six-game homestand with the first of three against Seattle on Tuesday. Right-hander Dean Kremer (8-8, 4.35) will try to halt a stretch of three outings without a quality start.
How can I watch Athletics vs. Baltimore Orioles?
- TV Channel: Athletics at Orioles 2022 MLB Baseball, is broadcasted on MLB.TV.
- Online streaming: Sign up for Fubo.
Scoring Summary
 |
9th Inning | Westburg struck out swinging. |
 |
9th Inning | Holliday walked. |
 |
9th Inning | Carlson grounded out to second. |
 |
9th Inning | Allen struck out swinging. |
 |
9th Inning | Butler in center field. |
 |
9th Inning | Thomas in right field. |
Statistics
 ATH ATH |
 BAL BAL |
|
|---|---|---|
| 1 | Games Played | 1 |
| 1 | Team Games Played | 1 |
| 0 | Hit By Pitch | 0 |
| 10 | Ground Balls | 8 |
| 11 | Strikeouts | 12 |
| 3 | Runs Batted In | 2 |
| 0 | Sacrifice Hit | 0 |
| 6 | Hits | 5 |
| 0 | Stolen Bases | 1 |
| 5 | Walks | 8 |
| 0 | Catcher Interference | 0 |
| 3 | Runs | 2 |
| 0 | Ground Into Double Play | 0 |
| 0 | Sacrifice Flies | 0 |
| 32 | At Bats | 30 |
| 0 | Home Runs | 1 |
| 0 | Grand Slam Home Runs | 0 |
| 14 | Runners Left On Base | 19 |
| 0 | Triples | 1 |
| 1 | Game Winning RBIs | 0 |
| 0 | Intentional Walks | 1 |
| 2 | Doubles | 3 |
| 11 | Fly Balls | 10 |
| 1 | Caught Stealing | 1 |
| 153 | Pitches | 154 |
| 0 | Games Started | 0 |
| 0 | Pinch At Bats | 1 |
| 0 | Pinch Hits | 1 |
| 0.0 | Player Rating | 0.0 |
| 1 | Is Qualified | 1 |
| 1 | Is Qualified In Steals | 1 |
| 8 | Total Bases | 13 |
| 37 | Plate Appearances | 38 |
| 0.0 | Projected Home Runs | 162.0 |
| 2 | Extra Base Hits | 5 |
| 2.3 | Runs Created | 4.8 |
| .188 | Batting Average | .167 |
| .000 | Pinch Hit Average | 1.000 |
| .250 | Slugging Percentage | .433 |
| .188 | Secondary Average | .533 |
| .297 | On Base Percentage | .342 |
| .547 | OBP Pct + SLG Pct | .775 |
| 0.9 | Ground To Fly Ball Ratio | 0.8 |
| 2.3 | Runs Created Per 27 Outs | 5.0 |
| 22.0 | Batter Rating | 25.5 |
| 0.0 | At Bats Per Home Run | 30.0 |
| 0.00 | Stolen Base Percentage | 0.50 |
| 4.14 | Pitches Per Plate Appearance | 4.05 |
| .063 | Isolated Power | .267 |
| 0.45 | Walk To Strikeout Ratio | 0.67 |
| .135 | Walks Per Plate Appearance | .211 |
| .000 | Secondary Average Minus Batting Average | .367 |
| 6.0 | Runs Produced | 4.0 |
| 1.0 | Runs Ratio | 1.0 |
| 0.4 | Patience Ratio | 0.6 |
| 0.3 | Balls In Play Average | 0.2 |
| 70.8 | MLB Rating | 73.8 |
| 0.0 | Offensive Wins Above Replacement | 0.0 |
| 0.0 | Wins Above Replacement | 0.0 |
Game Information
Location: Baltimore, Maryland
Attendance: 23,183 | Capacity:
2025 American League West Standings
| TEAM | W | L | PCT | GB | STRK |
|---|---|---|---|---|---|
 Houston Houston |
- | 67 | W1 | 0.5410959 | 79 |
 Seattle Seattle |
1 | 68 | W5 | 0.53424656 | 78 |
 Texas Texas |
2.5 | 70 | W4 | 0.52380955 | 77 |
 Los Angeles Los Angeles |
10 | 77 | W2 | 0.47260273 | 69 |
 Athletics Athletics |
12.5 | 80 | W1 | 0.45578232 | 67 |
2025 American League East Standings
| TEAM | W | L | PCT | GB | STRK |
|---|---|---|---|---|---|
 Toronto Toronto |
- | 62 | L1 | 0.5724138 | 83 |
 New York New York |
3 | 65 | L2 | 0.55172414 | 80 |
 Boston Boston |
3 | 66 | L1 | 0.5510204 | 81 |
 Tampa Bay Tampa Bay |
11 | 73 | L1 | 0.49655172 | 72 |
 Baltimore Baltimore |
15 | 77 | W2 | 0.46896553 | 68 |