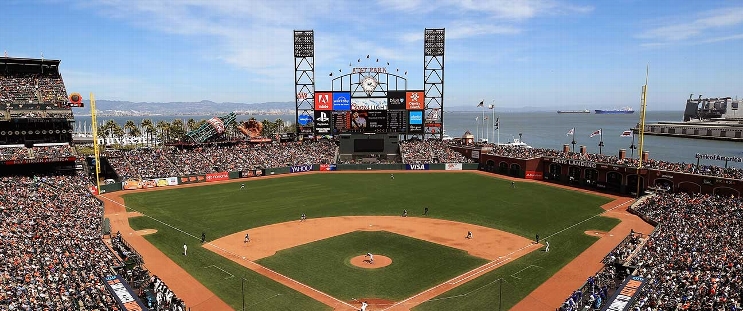
Washington Nationals at San Francisco Giants
· Major League Baseball
0 - 5

Devers homers early and Giants blank Nationals 5-0

Matt Chapman had two hits and an RBI for the Giants. Dominic Smith added two singles to extend his hitting streak to 12 games.
Kai-Wei Teng (1-1) pitched five smooth innings in relief for his first major league win. The 26-year-old from Taiwan followed opener Matt Gage and allowed three hits with one walk with four strikeouts.
Joey Lucchesi, José Buttó and Tristan Beck each retired three batters to complete the four-hitter.
The Giants had lost eight straight at Oracle Park — one shy of their longest home skid of the San Francisco era — before beating the Nationals for the third time in four meetings this season.
Devers, acquired from Boston in June, launched his 21st home run of the season off Jake Irvin (8-7) in the first. Chapman’s RBI single later in the inning made it 2-0.
Schmitt’s homer, a two-run drive in the sixth, was his second in six days.
San Francisco added a run in the eighth on Patrick Bailey’s infield single.
Irvin allowed eight hits and four runs (three earned) in 5 1/3 innings.
How can I watch Washington Nationals vs. San Francisco Giants?
- TV Channel: Nationals at Giants 2022 MLB Baseball, is broadcasted on MLB.TV.
- Online streaming: Sign up for Fubo.
Scoring Summary
 |
9th Inning | Lowe lined out to right. |
 |
9th Inning | House flied out to right. |
 |
9th Inning | Abrams lined out to right. |
 |
9th Inning | Beck relieved Buttó |
 |
8th Inning | Ramos flied out to second. |
 |
8th Inning | Ribalta relieved Ogasawara |
Statistics
 WSH WSH |
 SF SF |
|
|---|---|---|
| 1 | Games Played | 1 |
| 1 | Team Games Played | 1 |
| 0 | Hit By Pitch | 0 |
| 8 | Ground Balls | 13 |
| 7 | Strikeouts | 4 |
| 0 | Runs Batted In | 5 |
| 0 | Sacrifice Hit | 0 |
| 4 | Hits | 10 |
| 0 | Stolen Bases | 0 |
| 2 | Walks | 2 |
| 0 | Catcher Interference | 0 |
| 0 | Runs | 5 |
| 2 | Ground Into Double Play | 0 |
| 0 | Sacrifice Flies | 0 |
| 29 | At Bats | 35 |
| 0 | Home Runs | 2 |
| 0 | Grand Slam Home Runs | 0 |
| 11 | Runners Left On Base | 17 |
| 0 | Triples | 1 |
| 0 | Game Winning RBIs | 1 |
| 0 | Intentional Walks | 0 |
| 1 | Doubles | 1 |
| 14 | Fly Balls | 18 |
| 0 | Caught Stealing | 0 |
| 125 | Pitches | 146 |
| 0 | Games Started | 0 |
| 0 | Pinch At Bats | 0 |
| 0 | Pinch Hits | 0 |
| 0.0 | Player Rating | 0.0 |
| 1 | Is Qualified | 1 |
| 0 | Is Qualified In Steals | 0 |
| 5 | Total Bases | 19 |
| 31 | Plate Appearances | 37 |
| 0.0 | Projected Home Runs | 324.0 |
| 1 | Extra Base Hits | 4 |
| -0.3 | Runs Created | 6.2 |
| .138 | Batting Average | .286 |
| .000 | Pinch Hit Average | .000 |
| .172 | Slugging Percentage | .543 |
| .103 | Secondary Average | .314 |
| .194 | On Base Percentage | .324 |
| .366 | OBP Pct + SLG Pct | .867 |
| 0.6 | Ground To Fly Ball Ratio | 0.7 |
| -0.3 | Runs Created Per 27 Outs | 6.7 |
| 6.0 | Batter Rating | 40.5 |
| 0.0 | At Bats Per Home Run | 17.5 |
| 0.00 | Stolen Base Percentage | 0.00 |
| 4.03 | Pitches Per Plate Appearance | 3.95 |
| .034 | Isolated Power | .257 |
| 0.29 | Walk To Strikeout Ratio | 0.50 |
| .065 | Walks Per Plate Appearance | .054 |
| -.034 | Secondary Average Minus Batting Average | .029 |
| 0.0 | Runs Produced | 10.0 |
| 0.0 | Runs Ratio | 1.0 |
| 0.2 | Patience Ratio | 0.6 |
| 0.2 | Balls In Play Average | 0.3 |
| 60.5 | MLB Rating | 91.3 |
| 0.0 | Offensive Wins Above Replacement | 0.0 |
| 0.0 | Wins Above Replacement | 0.0 |
Game Information

Location: San Francisco, California
Attendance: 38,679 | Capacity:
2025 National League East Standings
| TEAM | W | L | PCT | GB | STRK |
|---|---|---|---|---|---|
 Philadelphia Philadelphia |
- | 60 | W3 | 0.5890411 | 86 |
 New York New York |
10 | 70 | L5 | 0.5205479 | 76 |
 Miami Miami |
19 | 79 | W1 | 0.45890412 | 67 |
 Atlanta Atlanta |
21 | 81 | L2 | 0.44520548 | 65 |
 Washington Washington |
25.5 | 85 | L1 | 0.41379312 | 60 |
2025 National League West Standings
| TEAM | W | L | PCT | GB | STRK |
|---|---|---|---|---|---|
 Los Angeles Los Angeles |
- | 64 | W4 | 0.56164384 | 82 |
 San Diego San Diego |
3 | 67 | L2 | 0.5410959 | 79 |
 San Francisco San Francisco |
8 | 72 | L1 | 0.5068493 | 74 |
 Arizona Arizona |
9.5 | 74 | W1 | 0.49659863 | 73 |
 Colorado Colorado |
42 | 106 | L5 | 0.2739726 | 40 |